
Nagios is a powerful monitoring system that enables organizations to identify and resolve IT infrastructure problems before they affect critical business processes.
After experiencing problems with a HP Proliant DL380G6 that unexpectedly restarts, caused by a Automated Server Recovery (ASR), monitoring the status of the Citrix XenServers running on HP Proliant Servers is required in Nagios.
Nagios is a flexible solution that can be expanded with plugins. Plugins can be found at Nagios Exchange, this is where I found the check check_hpasm plugin (direct link). Unfortunately this plugin does not check the ASR status.
In this article I will describe how I’ve configured Groundwork (using Nagios) to monitor the health of HP Proliant Servers and expanded the check_hpasm plugin to check for ASR health.
check_hpasm operation modes
The check_hpasm plugin can operate in two modes: local and remote.
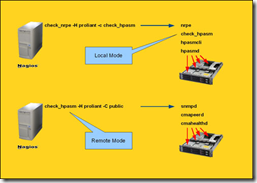 In local mode the check_hpasm plugin is installed on the Citrix XenServer accompanied with a Nagios plugin. The Nagios plugin (nrpe) queries the check_hpasm plugin. This requires at least two additional agents to be installed on the Citrix XenServer which is not recommended.
The remote mode uses SNMP to query the HP System Health Monitor. This prevents installing plugins on the Citrix XenServer but requires SNMP to be configured and accessible from the Nagios server.
For this setup I’ve configured the remote mode using SNMP (and preventing installing plugins on the Citrix XenServers).
Prerequisite – HP System Health Monitor (hpasmd)
On the Citrix XenServer the “HP Proliant Support Pack” and “HP Health Application and Insight Management Agent” needs to be installed. These can be downloaded from hp.com under “Support & Drivers”. Or you can download the “HP SNMP Agent for Citrix XenServer 5.x” here.
Before continuing to installing the check_hpasm plugin you need to make sure the hpasm agent (daemon) is accessible via SNMP from the Nagios server.
# snmpwalk -c public –v1 <IP-address of your XenServer> 1.3.6.1.4.1.232

SNMPv2-SMI::enterprises.232.1.1.1.0 = INTEGER: 1
SNMPv2-SMI::enterprises.232.1.1.2.0 = INTEGER: 23
SNMPv2-SMI::enterprises.232.1.1.3.0 = INTEGER: 2
SNMPv2-SMI::enterprises.232.1.2.1.4.1.0 = INTEGER: 30
SNMPv2-SMI::enterprises.232.1.2.1.4.2.1.1.1 = INTEGER: 1
SNMPv2-SMI::enterprises.232.1.2.1.4.2.1.2.1 = STRING: "Compaq Standard Equipment Agent for Linux"
Installing check_hpasm plugin
Since where using the remote operation mode of the check_hpasm plugin the plugin needs to be installed on the Nagios (or Groundwork) server.
The check_hpasm plugin can be downloaded from Console Labs. Either download the files from the Nagios server or upload them, for instance using WinSCP.
Connect via a Secure Shell (SSH) to the Nagios server, for instance with PuTTY, and change the directory to the location where you placed the tarball (.tar.gz).
Unpack the tarball
# tar xzvf check_hpasm-4.1.2.tar.gz
Configure the plugin with the following options
| Option | Explanation |
| –disable-hwinfo | If you don’t want to see type, serial number and biosrelease in the output, you can switch this off by using this option. |
| –enable-hpacucli | Activate checking of RAID controllers. |
| –enable-perfdata | Add performance data to it’s output by default. |
| –with-degrees | Temperatures values displayed in celcius instead of fahrenheit. |
| –with-nagios-user | Defines the Nagios user |
| –with-nagios-group | Defines the Nagios group |
| –with-noinst-level | Defines the exit code if no hpasm rpm was installed. |
./configure --prefix=/opt/plugins/custom/hp-insight --with-nagios-user=monitor --with-nagios-group=users –enable-hpacucli --enable-perfdata –with-degrees
Compile
# make
...
# make install
...
And finally test the plugin
# /opt/plugins/custom/hp-insight/libexec/check_hpasm -H 10.0.0.1 -C public

OK - System: 'proliant dl360 g3', S/N: '7J31LMW6N01D', ROM: 'P31 01/28/2004', hardware working fine, da: 1 logical drives, 1 physical drives | fan_1=50% fan_2=50% temp_1_cpu=16;50;50 temp_2_cpu=15;65;65 temp_3_ioBoard=21;56;56 temp_4_cpu=20;65;65
You now have configured the check_hpasm plugin and the hardware monitoring running.
Altering check_hpasm to incorporate ASR
The check_hpasm plugin checks the health of Processors, Power supplies, Memory modules, Fans, CPU- and board-temperatures and Raids. Unfortunately the status of ASR isn’t part of the health check.
Determine ASR status
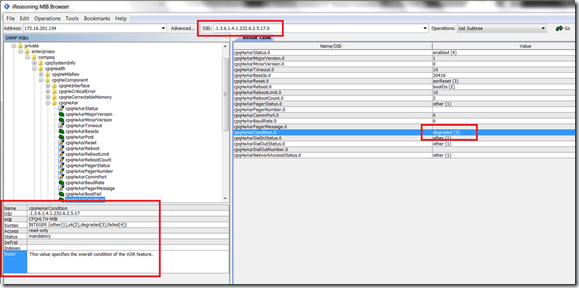
I’ve downloaded the cpqhlth.mib MIB (part of the HP Insight Management MIB Kit) and ran a query via SNMP on one of the Citrix XenServers via iReasoning MIB Browser (Free and really useful). If found that there is an OID that specifies the overall condition of the ASR feature (1.3.6.1.4.1.232.6.2.5.17.0 or .iso.dod.internet.private.enterprise.compaq.cpqHealth.cpqHeComponent.cpqHeAsr.cpqHeAsrCondition.0).
I’ve checked the status of the VH04 (one of the servers that unexpectedly restarts) and saw that the status reported was degraded (3). A check on the VH01, which didn’t suffer problems with ASR showed me a different result : ok (2), as expected.
Editing script
I’ve downloaded the check_hpasm script via WinSCP (which can be found in /opt/plugins/custom/hp-insight/libexec) and it in Perl Express (A Free Perl IDE/Editor for Windows).
I noticed there was a procedure called ‘overall_check’ where I could incorporate a simple check for the ASR status. I’ve altered the script on a few places to incorporate the check via the OID I found in the MIB (still following me?).
sub overall_init
sub overall_init {
...
  my $cpqHeAsrCondition = '1.3.6.1.4.1.232.6.2.5.17.0';
  my $cpqHeAsrConditionValue = {
    1 => 'other',
    2 => 'ok',
    3 => 'degraded',
    4 => 'failed',
  };
...
  $self->{asrstatus} = lc SNMP::Utils::get_object_value(
      $snmpwalk, $cpqHeAsrCondition,
      $cpqHeThermalSystemFanStatusValue);
...
sub overall_check
sub overall_check {
...
  if ($self->{asrstatus}) {
    if ($self->{asrstatus} eq 'degraded') {
      $result = 1;
      $self->add_message(WARNING,
          sprintf 'ASR overall status is %s', $self->{asrstatus});
    } elsif ($self->{asrstatus} eq 'failed') {
      $result = 2;
      $self->add_message(CRITICAL,
          sprintf 'ASR overall status is %s', $self->{asrstatus});
    }
  } else {
    $self->add_info('This system does not have ASR.');
  }
...
sub collect
sub collect {
...
      my $cpqHeAsr     = "1.3.6.1.4.1.232.6.2.5";
...
      # Walk for ASR
      $tic = time;
      my $response2a = $session->get_table(
          -maxrepetitions => 1,
          -baseoid => $cpqHeAsr);
      if (scalar (keys %{$response2a}) == 0) {
        $self->trace(2, sprintf "maxrepetitions failed. fallback");
        $response2a = $session->get_table(
            -baseoid => $cpqHeAsr);
      }
      $tac = time;
      $self->trace(2, sprintf "%03d seconds for walk $cpqHeAsr (%d oids)",
          $tac - $tic, scalar(keys %{$response2a}))
...
      map { $response->{$_} = $response2a->{$_} } keys %{$response2a};
...
The end result would look like this:
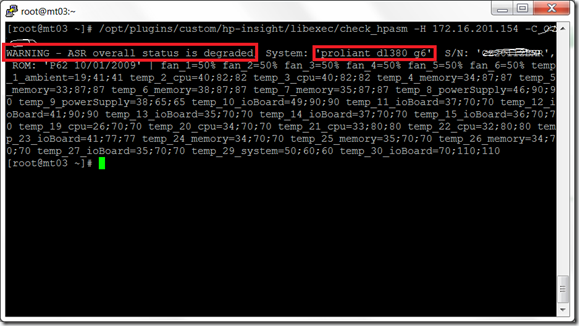
The script is uploaded again and tested from the Nagios server to determine the health of the VH04 server.
The result is as expected, the check_hpasm gives a warning about a degraded ASR on the VH04.
Groundwork / Nagios
Now the plugin has to be incorporated in the Nagios (or in my case Groundwork which uses Nagios) configuration. This can be done by editing the configuration files or via the GUI.
Edit configuration files
The command ‘check_hpasm’ is stored in the checkcommands.cfg file. This file is located in the ‘?/nagios/etc/ directory for Nagios and in the ‘/usr/local/groundwork/core/monarch/workspace/’ directory for Groundwork.
checkcommands.cfg
# command 'check_hpasm'
define command{
    command_name                   check_hpasm
    command_line                   /opt/plugins/custom/hp-insight/libexec/check_hpasm -H $HOSTADDRESS$ -C $ARG1$
    }
GUI
Since I’m using Groundwork I prefer to add the command and the service via the GUI.
Command ‘check_hpasm’
- Open the ‘Configuration’ tab
- Click on the ‘Commands’ tab
- On the left pane click ‘Commands > New’
- Enter the details of the command
- Name of the command ‘check_hpasm’
- Type : check
- Command line : /opt/plugins/custom/hp-insight/libexec/check_hpasm –H $HOSTADDRESS$ –C $ARG1$
- Click Save
Service ‘HP_Insight_Manager’
- Open the ‘Configuration’ tab
- Click on the ‘Services’ tab
- On the left pane click ‘Services > New Service’
- Enter the basics of the service
- Service name : HP_Insight_Manager
- Service template : generic-servic
- Click Add
- Enter the details of the service
- Check command : check_hpasm
- Command line : <SNMP Read-Only communitry string> (for instance Public)
- Click Save (important!)
- Select ‘Service Profiles’ tab
- Add the service profile you want to add it to (in my case ‘Xen service profile’)
- Click Save
Hosts
Since the change in the service profile (adding a service) isn’t pushed to all hosts by default I will add them manually
- Open the ‘Configuration’ tab
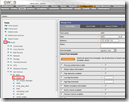
- Click on the ‘Hosts’ tab
- Expand ‘Hosts’ until you reach the node requested.
- Click on the ‘Detail’ node
- Click on the ‘Services’ tab
- Select the service ‘HP_Insight_Manager’
- Click ‘Add Service(s )
Repeat the task for all Citrix XenServers (…)
Apply configuration
The changes in the configuration needs to be applied to the Groundwork / Nagios engine.
Pre flight test
Before the configuration is applied a Pre flight test can be executed to determine if the configuration is working correctly.
- Open the ‘Configuration’ tab
- Click on the ‘Control’ tab
- On the left pane click ‘Pre flight check’
- If the result in the right pane says ‘Success’ your good to go!
Commit
After a successful Pre flight check the configuration can be applied to the Groundwork / Nagios engine.
- Open the ‘Configuration’ tab
- Click on the ‘Control’ tab
- On the left pane click ‘Commit’
- On the right pane click ‘Backup’ (just to be sure)
- On the right pane click ‘Commit’
- If the result in the right pane says ‘Success’ you don’t have to restore the backup

Check!
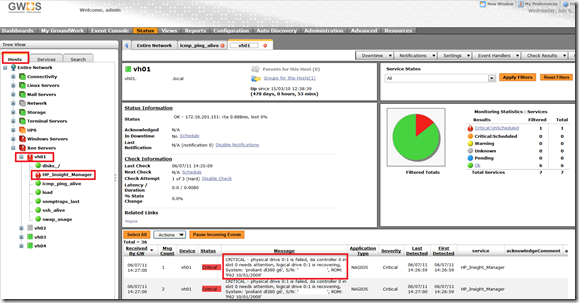
Final step is to check if the configuration is applied and the servers are indeed monitored with the HP_Insight_Manager service.
- Open the ‘Status’ tab
- Expand the Hosts treeview until you reach a Citrix XenServer (VH01 in my case)
- Determine if there is a ‘HP_Insight_Manager’ service
Edit 22-07-2010:
Just received an e-mail from Gerhard Lausser (author of check_hpasm). He updated the plugin (v4.2.4) and included the ASR check (changelog).
Ingmar Verheij






Miss representation, this is not nagios. Thanks for wasting my time groundwork!
Hi Mike,
Sorry that the post didn’t suit your needs. In this case I monitored the servers with Groundwork and as such I used the Groundwork for explaining the steps. Groundwork uses Nagios for monitoring so the servers are monitored by Nagios (the plugin is a Nagios plugin).
In the text i’ve explained which files you should change to get the plugin working. If you need any help, let me know.
Regards,
Ingmar